
Description:
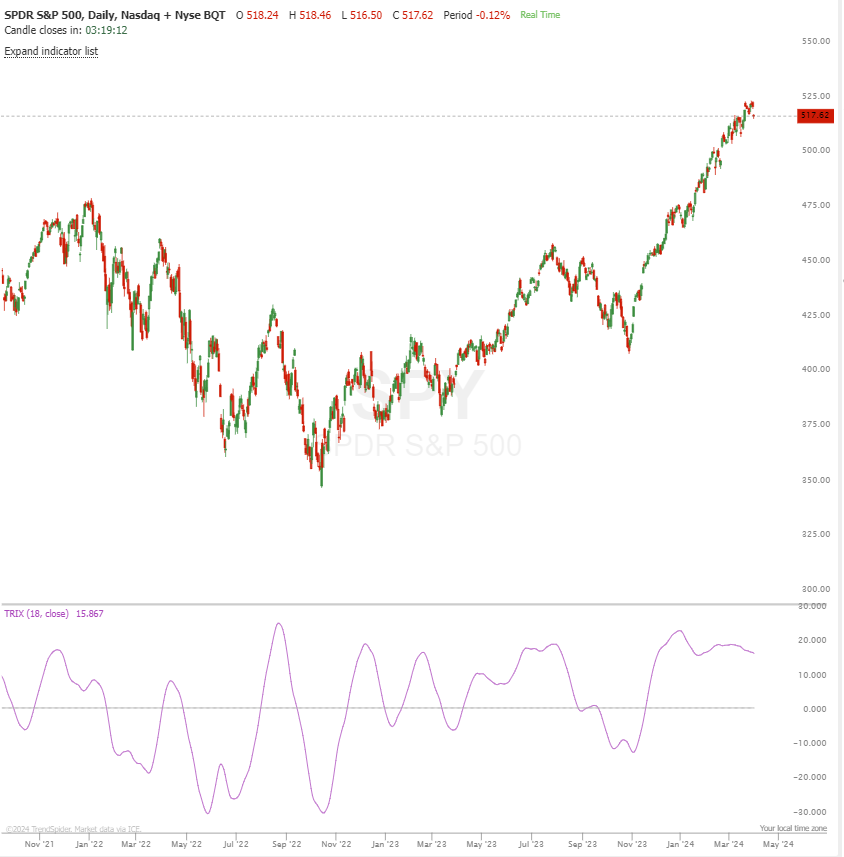
The TRIX indicator is a momentum oscillator that shows the rate of change of a triple exponentially smoothed moving average of the closing price. It is designed to filter out insignificant price movements and highlight the underlying trend by eliminating market noise. The triple smoothing of the moving average helps to center the indicator, making it excellent for identifying overbought and oversold conditions, as well as bullish and bearish divergences.
Input Parameters:
- Length: Number of periods used in the calculationn
Use Cases:
- Trend Identification: A positive TRIX value, where the indicator is moving upward, suggests an uptrend, while a negative TRIX value indicates a downtrend.
- Signal Line Crossovers: Buy signals occur when the TRIX crosses above its signal line, and sell signals happen when it crosses below. These crossovers can help confirm trend direction and momentum.
- Overbought/Oversold Conditions: While TRIX does not have fixed overbought or oversold levels, extreme readings can suggest potential price reversals if they coincide with other market analysis methods.
- Divergence: Bullish divergence occurs when the price records a lower low, but TRIX forms a higher low, suggesting weakening downward momentum. Conversely, bearish divergence happens when the price hits a higher high, but TRIX makes a lower high, indicating fading upward momentum.
Do you want to learn more? Check out our Learning Center Article.
What went wrong? (Optional)