Description:
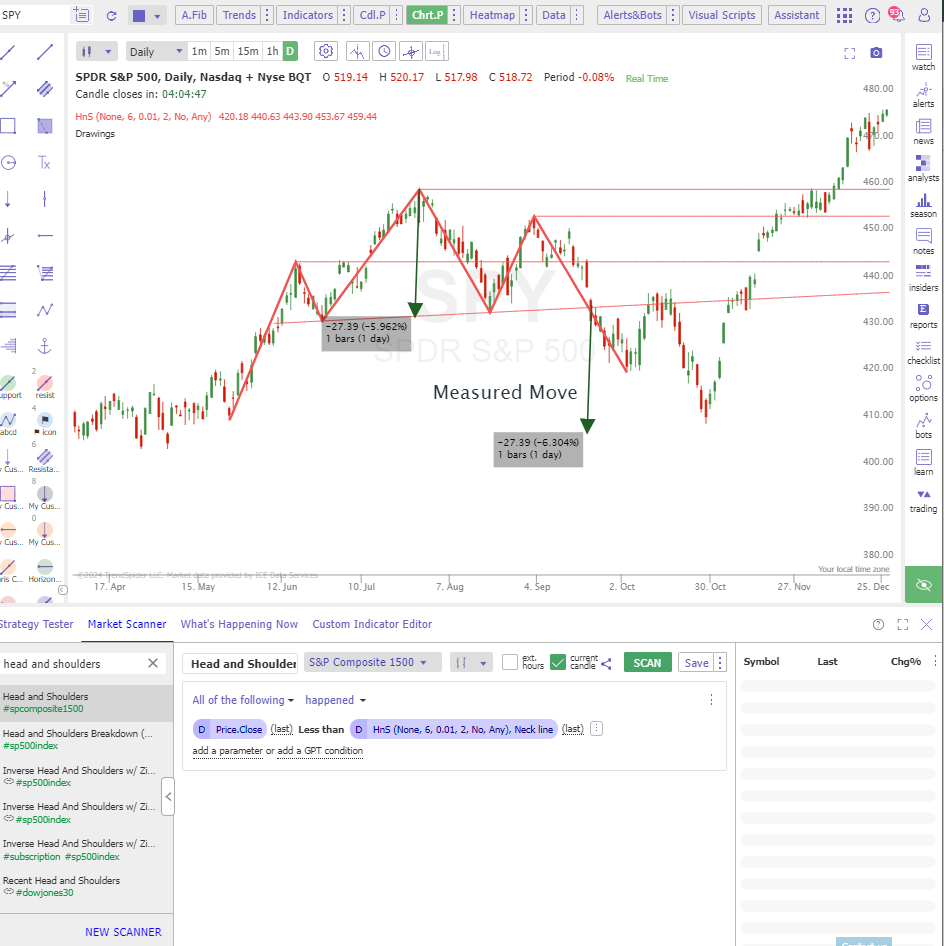
The Head and Shoulders pattern is a highly regarded bearish reversal configuration that emerges at the end of an uptrend. It is distinguished by three peaks: the left shoulder and the right shoulder are at approximately the same height, and the head is the highest point. Between these peaks are troughs, with the one following the head forming the "neckline" – a support level drawn through the lowest points of the two troughs. This pattern signifies a shift in market dynamics, where buyers lose momentum, and sellers begin to take control, indicating a potential trend reversal from bullish to bearish.
Input Parameters:
- Retracement: Apply Fibonacci retracements.
- Bands: Choose from select brands such as ATR, St.Dev, Constant, or Percentage bands
- Head Height: Distance between leg shoulder peak and head
Use Cases
- Pattern Identification: Detects the formation during or after a significant uptrend, focusing on the three peak structures and the neckline support.
- Entry Point: The completion of the pattern is confirmed when the price falls below the neckline after forming the right shoulder. Traders often consider this breakdown as an entry point for a short position.
- Stop-Loss Placement: To manage risks, a stop-loss is typically set just above the right shoulder or the head's peak, protecting against the possibility of the trend resuming its upward direction.
- Profit Targets: The profit target can be calculated by measuring the vertical distance from the head's peak to the neckline and then projecting that distance downward from the point where the price breaks the neckline.
Additionally, a bullish version of this pattern, known as the Inverse Head and Shoulders, signals a reversal from a downtrend to an uptrend. It features a central trough (head) flanked by two shallow troughs (shoulders), with a breakout above the neckline serving as a bullish signal. For both patterns, traders should seek confirmation through volume analysis—ideally, volume should increase on the breakout or breakdown—and consider other technical indicators to validate the reversal signal.
This feature can be used in:
- Market Scanner
- Smart Checklist
Do you want to learn more? Check out our Learning CenterArticle.