
Description:
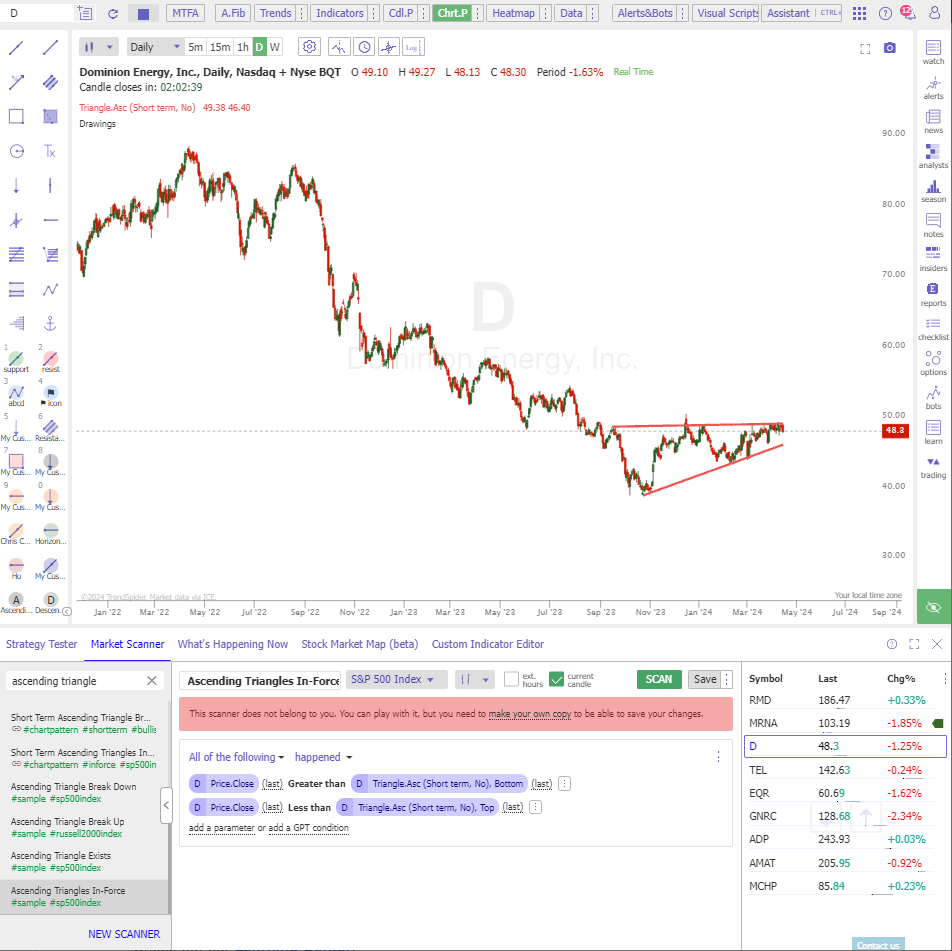
The Ascending Triangle is a bullish continuation chart pattern characterized by a horizontal upper trend line that acts as resistance and an ascending lower trend line that acts as support. This pattern forms due to the price making higher lows while hitting a consistent resistance level, indicating accumulation by buyers. The completion and validity of the pattern are confirmed once the price breaks out above the resistance.
Input Parameters:
- Time Span: Defines lookback period.
- Bands: Apply ATR, St.Dev, Constant, or Percentage bands.
Use Cases:
- Breakout Trading: Traders often enter long positions upon a decisive breakout above the resistance level, expecting a continuation of the prior uptrend.
- Volume Confirmation: Increased volume during the breakout can confirm the pattern's strength and reliability.
- Stop-Loss Placement: A stop-loss can be set just below the most recent swing low within the triangle to minimize potential losses if the breakout fails.
- Profit Targets: The height of the triangle's base can be added to the breakout point to estimate the potential rise in price.
The Ascending Triangle is popular among traders for its clear visual cues and reliable signals, especially in trending markets where it frequently appears.
Do you want to learn more? Check out our Learning Center Article.
Jan 14, 2026