
Description
The Average Directional Index (ADX) is a technical analysis indicator used to quantify the strength of a trend, irrespective of its direction. Developed by J. Welles Wilder, the ADX is part of the Directional Movement System, which also includes the Positive Directional Indicator (+DI) and Negative Directional Indicator (-DI). The ADX itself is a moving average of the price range expansion over a specified period and is designed to measure trend strength by rising during strong trends and falling during weak trends.
Input Parameters
- Length - number of periods used in the calculation
Use Cases
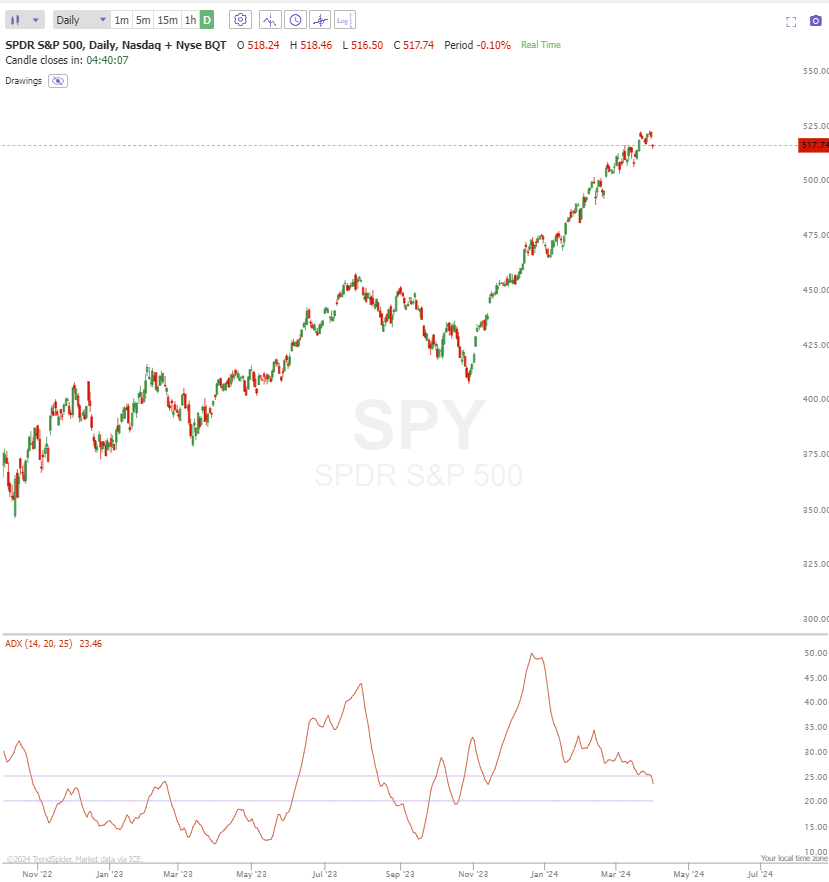
- Trend Strength Assessment - Values of ADX above 25 are generally interpreted as indicating a strong trend, either up or down, while values below 20 suggest a weak or non-trending market. Values in between may indicate the trend is developing.
- Trend Direction Confirmation - While the ADX itself does not indicate trend direction, it is often used in conjunction with the +DI and -DI lines. When +DI is above -DI, the market is considered to be in an uptrend; conversely, when -DI is above +DI, a downtrend is indicated.
- Identifying Potential Entry and Exit Points - Traders might use changes in the ADX, along with the crossover of the +DI and -DI lines, as potential signals for entering or exiting trades. For instance, an increasing ADX and +DI crossing above -DI may suggest a good time to enter a long position.
Want To Learn More?
Check out our Learning Center Article.
*
What went wrong? (Optional)