
Description:
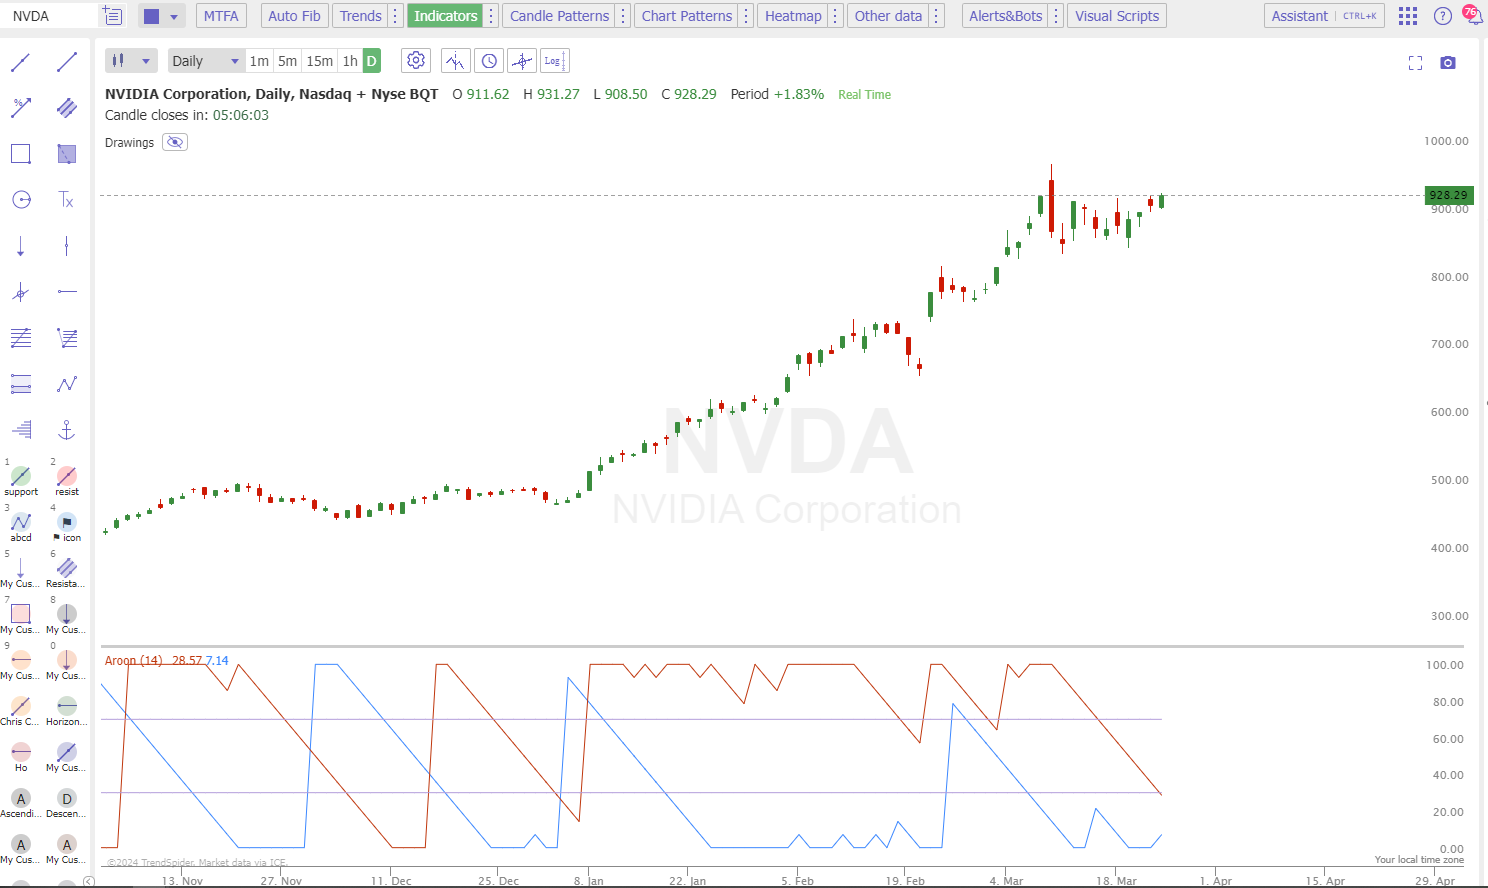
Measures the time since the last highest and lowest prices, indicating if a stock is trending or in a range-bound state. The Aroon indicator consists of two lines. The Aroon Up is measured as the number of periods since a new high. The Aroon Low is measured as the number of periods since a new low.
Input Parameters:
- Length: Number of periods used in the calculation.
Use Cases:
- Identify Trend Reversals: When the Aroon Up is above the Aroon Down this is a sign up bullish price action. When the Aroon Down is above the Aroon Up this can be a sign of bearish price action. Identifying when the two lines cross can indicate a trend reversal.
- Identify Trend Strength: If either line is close to 100, then this means that the trend is very strong. While values close to 0 indicate a weaker trend. When both values are below 50, this can indicate that price is consolidating.
Do you want to learn more? Check out our Learning Center Article.
*
What went wrong? (Optional)