
Description:
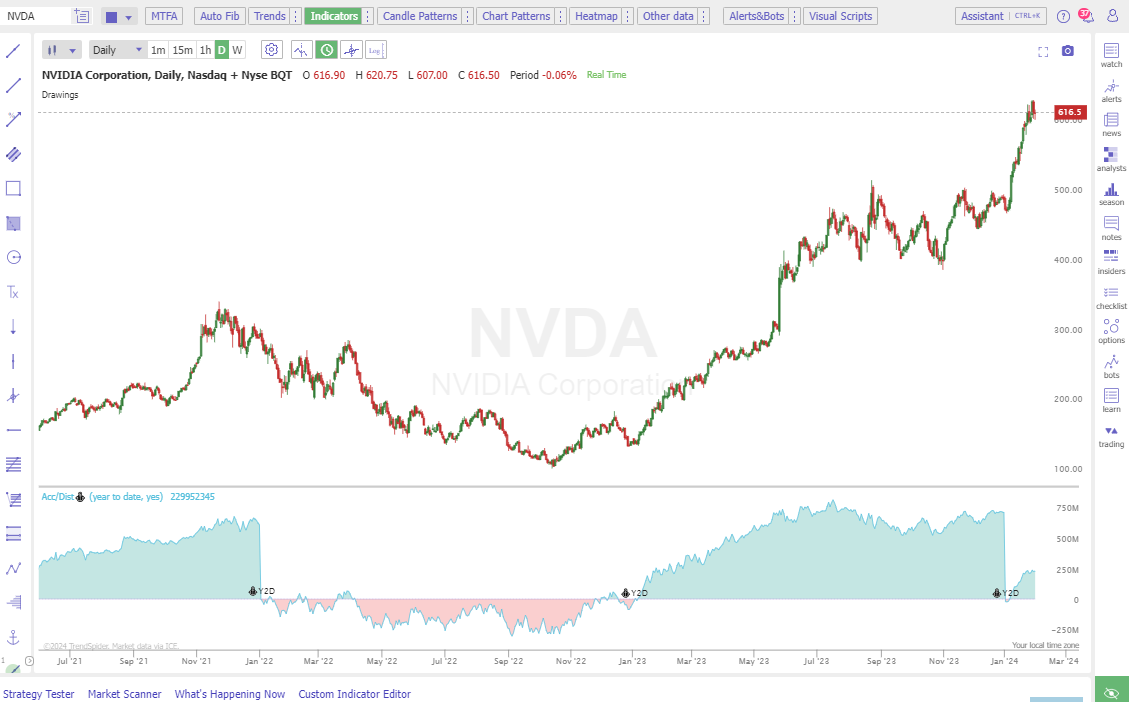
A customized version of the Accumulation/Distribution Line that starts accumulating from a user-defined anchor date, highlighting money flow trends from that point.
Input Parameters:
- Anchor To: determines the location of where you will automatically anchor the starting point.
- Window: The amount of candles a candle must dominate over in order to count as an appropriate anchor point". So in case, you do Window=5, then you'll be essentially anchoring to Williams Fractal points. If you do Window=20, then candle A will be recognized as the anchor point only in case no candle from 10 candles to the left and 10 candles to the right from A dominates over A
Use Cases:
- Combining the A/D Line with other indicators: Use the A/D Line in conjunction with other technical indicators, such as moving averages and Relative Strength Index (RSI), to improve the accuracy of your analysis.
- Identifying entry and exit points: When the A/D Line breaks above or below a trendline or support/resistance level, it can signal a potential entry or exit point.
Do you want to learn more? Check out ourLearning Center Article.
*
What went wrong? (Optional)