
Chart Patterns are formations created by the price action on a chart. They are one of the pillars of Technical Analysis, along with indicators, candlestick patterns and so on.
Some the most popular Chart Patterns are available on TrendSpider. The platform can automatically paint them on the charts. One can scan for the patterns — like "Find all the stocks from Russell 2K which have a Descending triangle on a Daily chart". One can also use Chart Patterns in Smart Checklists.
Our Chart Pattern recognition is focusing on actionable patterns only. We don't display patterns in the past. We discard ongoing patterns which don't seem to be respected by the price action any more. We discard patterns which are on their very early stages of development. We discard patterns which had been already "played out" shortly after the fact.
How to use Chart Patterns on TrendSpider
Think of our Chart Pattern detection as of your fellow advisor. It most cases it will be perfectly right. Sometimes it won't. But it never can decide for you. You should make your decisions anyways.
This means that a typical way for using Chart Patterns on TrendSpider is as follows:
- Scan to find charts with a given pattern emerging (or with price bouncing off it e.t.c.).
- Select the charts which have formations you do agree with.
- Proceed with the analysis (or paint rays and create alerts e.t.c.)
Identifying chart patterns (just like identifying trends) is a discipline where there's a room for being subjective. In some cases one trader would insist that there's a triangle on a chart, and the other one won't agree.
In the end, what matters is not "whether you follow a definition strictly" (even if it exists). What matters is whether the pattern is being confirmed (respected?) by the price action. That's what we're using when identifying patterns. We use formal definitions, common sense and a huge portion of additional logic and math atop of them.
Important note on Chart Types: Consider using Chart Patterns on different chart types. Patterns identified on Heikin Ashi or a Line chart can be way cleaner and sometimes would give you a signals you might miss otherwise.
Chart Patterns on Charts
In order to see Chart Patterns on Charts, you should click on a ... button next to the Chart Patterns in your top toolbar. Then, select the patterns you'd like to see. That's it.
Some of the Chart Patterns do have settings (just like some indicators do have input parameters). You can adjust them by clicking on ... button for the Chart Pattern in the Chart Key.
Scanning for Chart Patterns
You can scan for Chart Patterns, on any markets, any chart types and any time frames. In example, you can find all the charts which have bounced off a lower line of a Descending Triangle on a 1 hour chart.
Using Chart Patterns in scanning is pretty straightforward and is very similar to using Indicators. Besides of scanning for particular interaction of a price and a pattern, you can also scan for charts which have a recent relevant pattern disregarding of what the last candle is doing. if you want to do so, you can arrange your criteria like Daily Triangle, Ascending Exists.
You can also scan for Indicators interacting with the Chart Patterns. In example, you can find all the charts where Bollinger Bands is squeezed into a symmetrical triangle.
Important note on scanning: when scanning for Chart Patterns, please do prefer enabling the Current Candle checkbox in your scanner. Doing so will guarantee consistency between your charts and results of scanning.
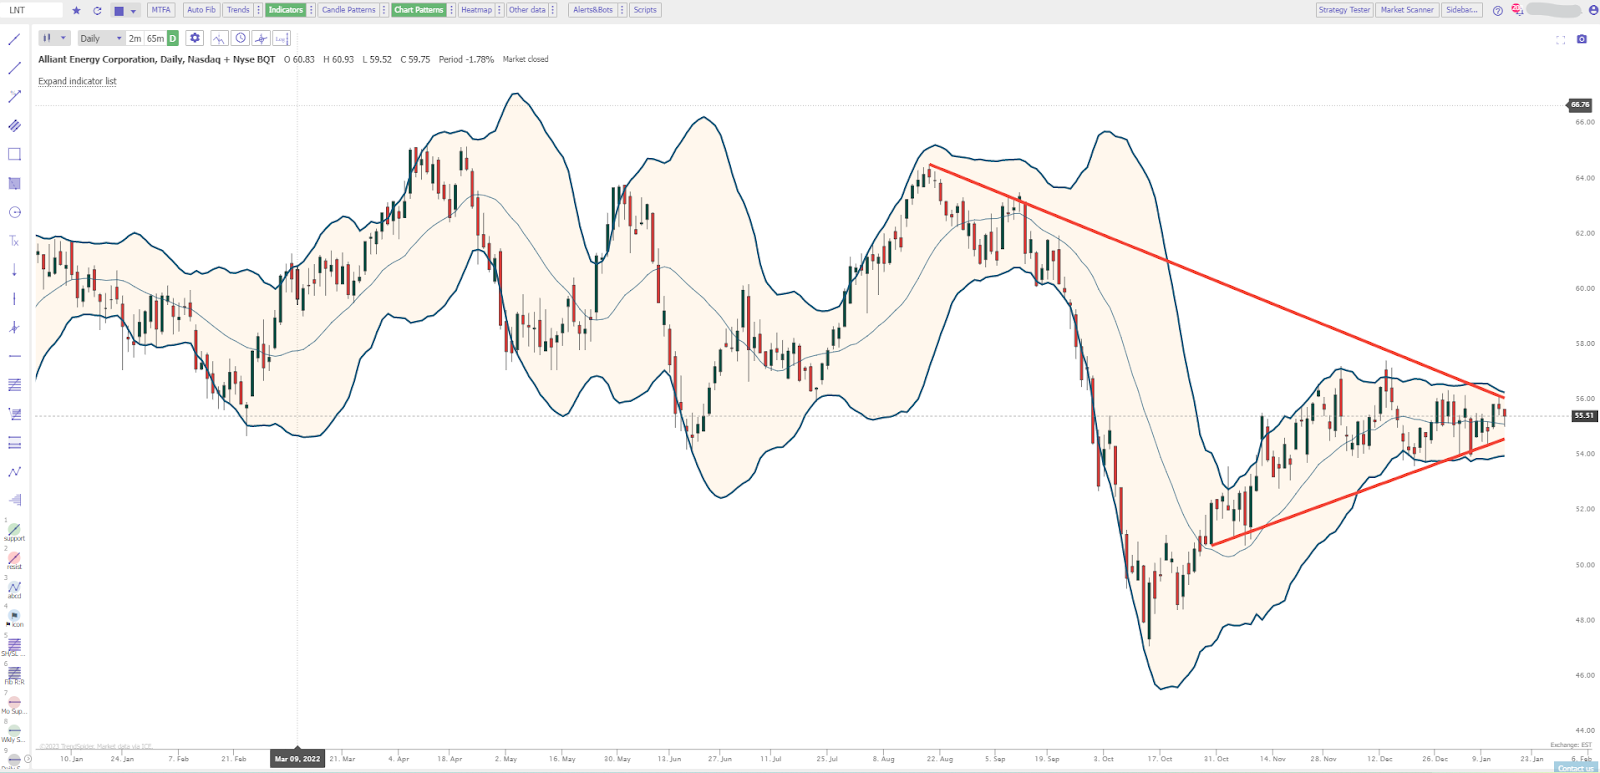
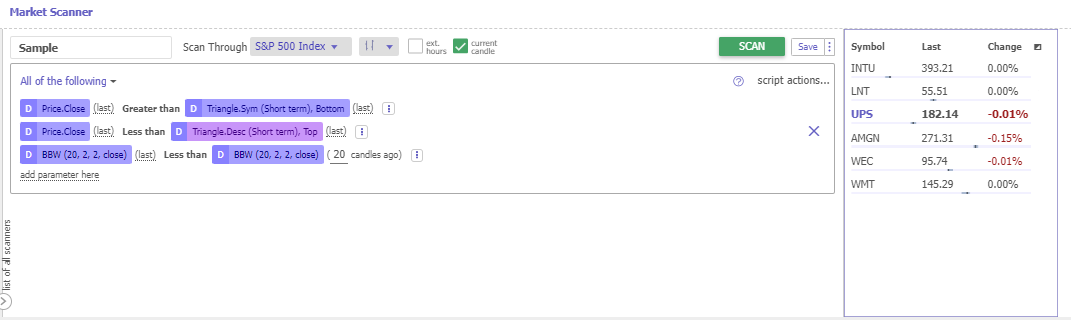
Chart Patterns in Alerts and Strategy Tester
At a current stage backtesting or alerts on Chart Patterns are not supported. You can work around the Alerts limitation by painting a Ray annotation atop of a pattern you like and then creating an alert on it.
Known limitations of Chart Patterns
A. Alerts and backtesting are not supported for Chart Patterns.
B. There could be false positives of false negatives in scanners in case if you're not using the "Current candle" option.
C. Chart Patterns painted on charts do not respond to real time updates (i.e., their lines do not extend)
D. If you open a chart after a while than a Chart Pattern which used to be there might go away. That might happen if our logic decides that this Chart Pattern is not as relevant any more as it used to be.
Chart Patterns supported on TrendSpider
Triangle, Ascending
This kind of a Triangle should be formed by a horizontal resistance level at the top and a diagonal trend line at the bottom. We do allow some "not perfectly horizontal yet still very close" lines for the Top line, as we've found that resulting in identifying more of patterns of a decent quality.
Discarding stale patterns: We'll only detect Ascending Triangle which is either still forming or had been just "played out" recently. We discard Triangles which have a point where lines cross either too far in the future or too deep in the past.
Input parameters: Ascending Triangle has only 1 parameter: Time Span. This parameter can be either Short Term or Long Term. It regulates what kind of triangles should be preferred, by adjusting a number of low-level technical inputs for the Triangle Recognition logic (like length of some Fractals and other indicators and so on). Please note that depending on a chart, both parameters might yield the same triangle (in case if it's so good that the math prefers it anyways).

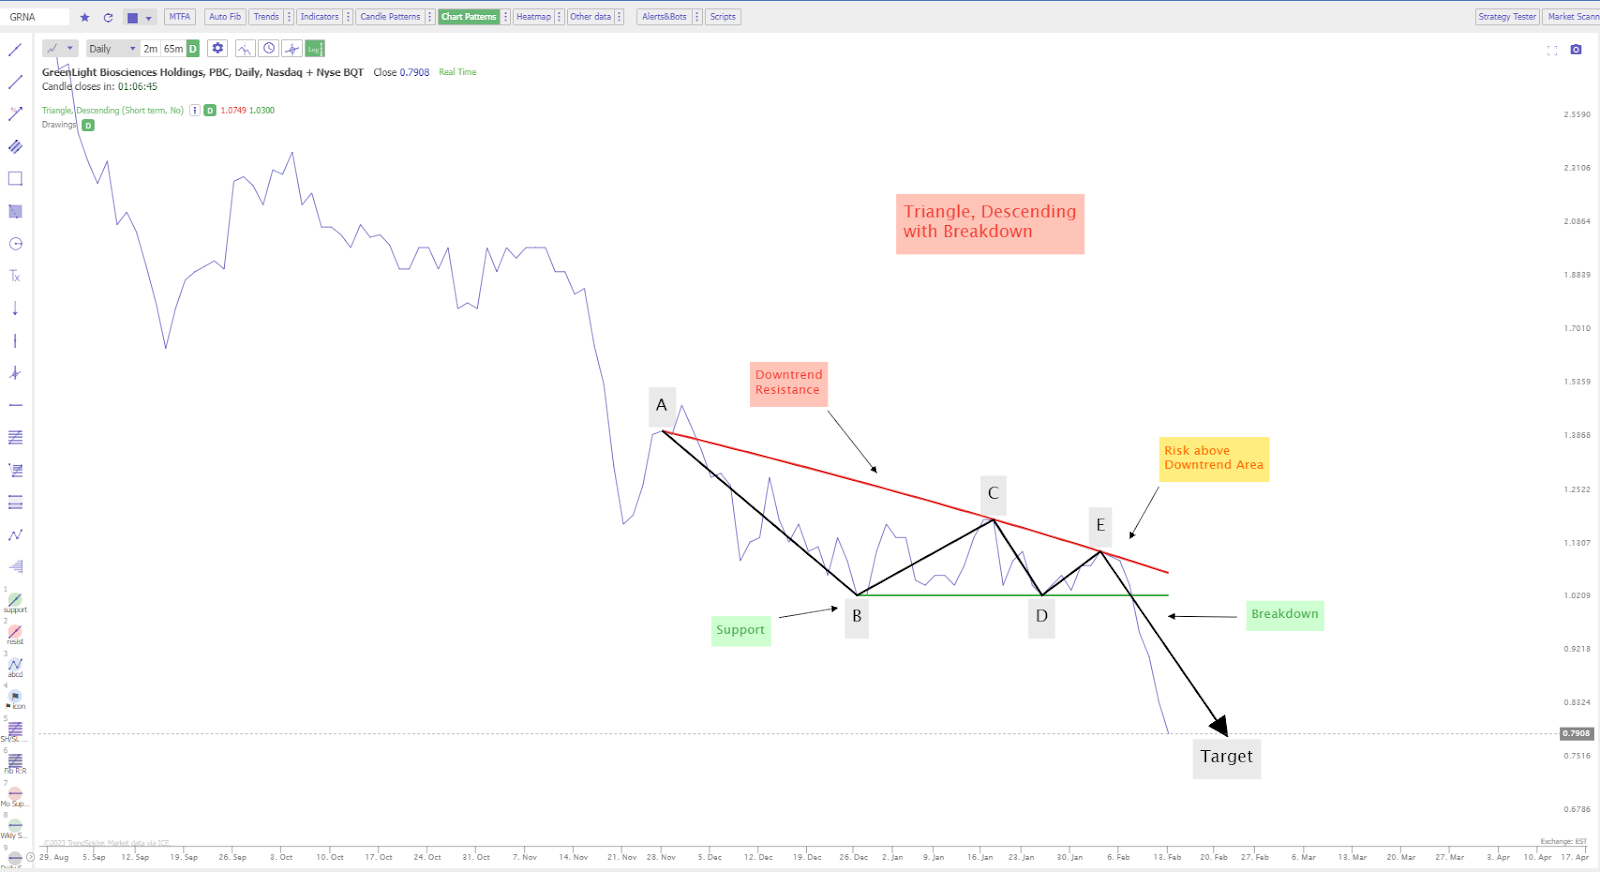
Triangle, Descending
This kind of a Triangle should be formed by a horizontal support level at the bottom and a diagonal trend line at the bottom. We do allow some "not perfectly horizontal yet still very close" lines for the Bottom line, as we've found that resulting in identifying more of patterns of a decent quality.
Discarding stale patterns: The same as for Ascending Triangle
Input parameters: The same as for Ascending Triangle
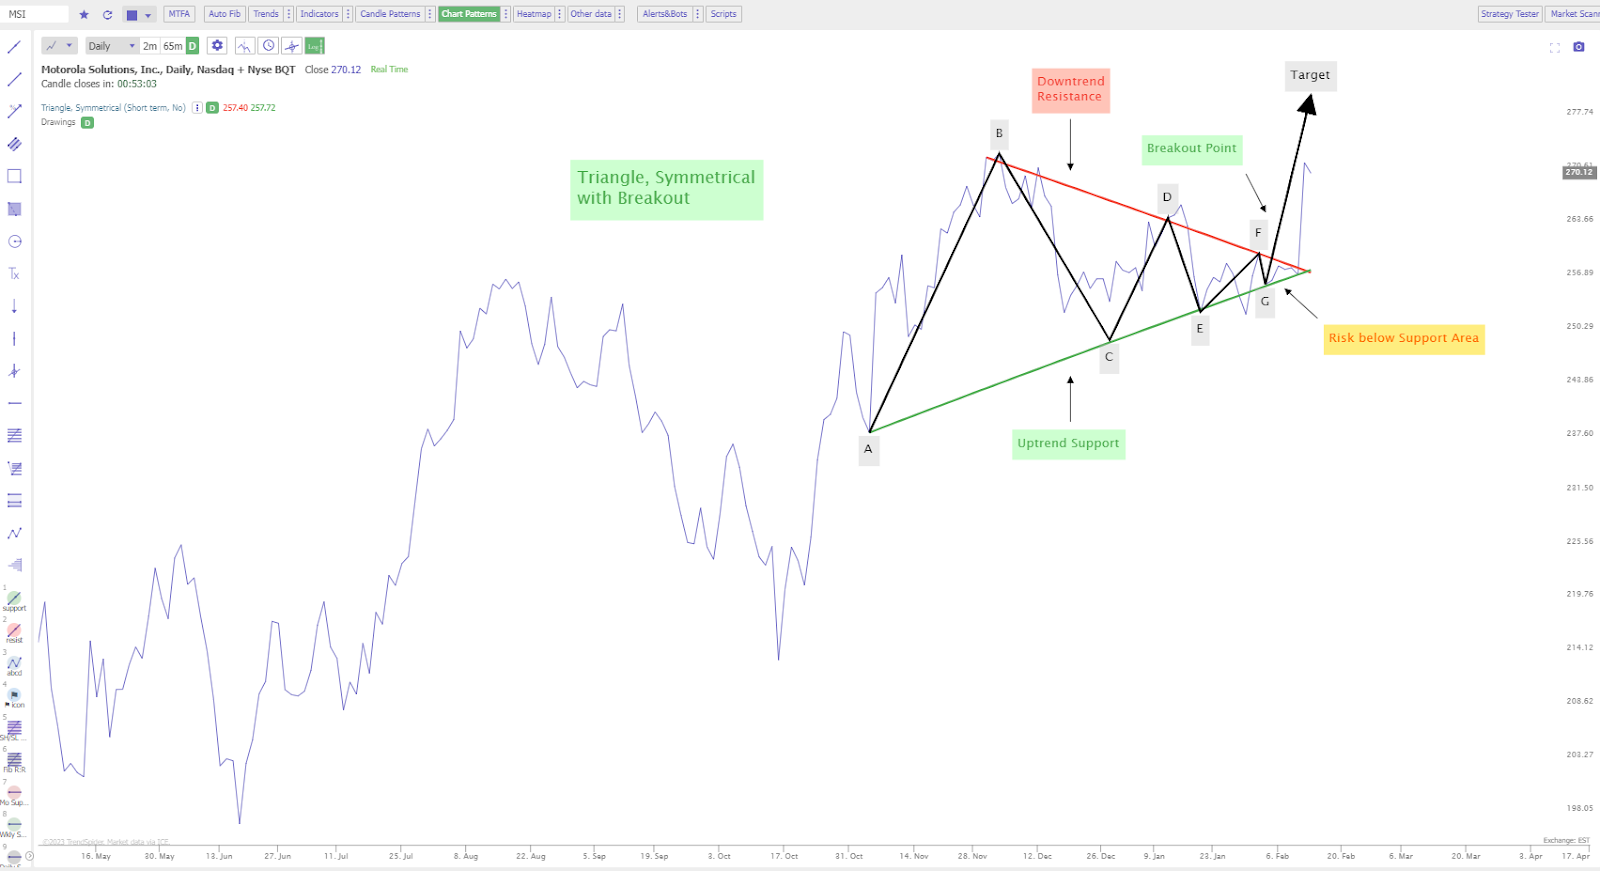
Triangle, Symmetrical
This kind of a Triangle should be formed by 2 diagonal trend lines, one from the top and 1 from the bottom. In our rules we prefer triangles which are either perfectly (or "almost perfectly") symmetrical. Formations which look like a triangle but which are too far from being symmetrical are discarded.
Discarding stale patterns: The same as for Ascending Triangle
Input parameters: The same as for Ascending Triangle

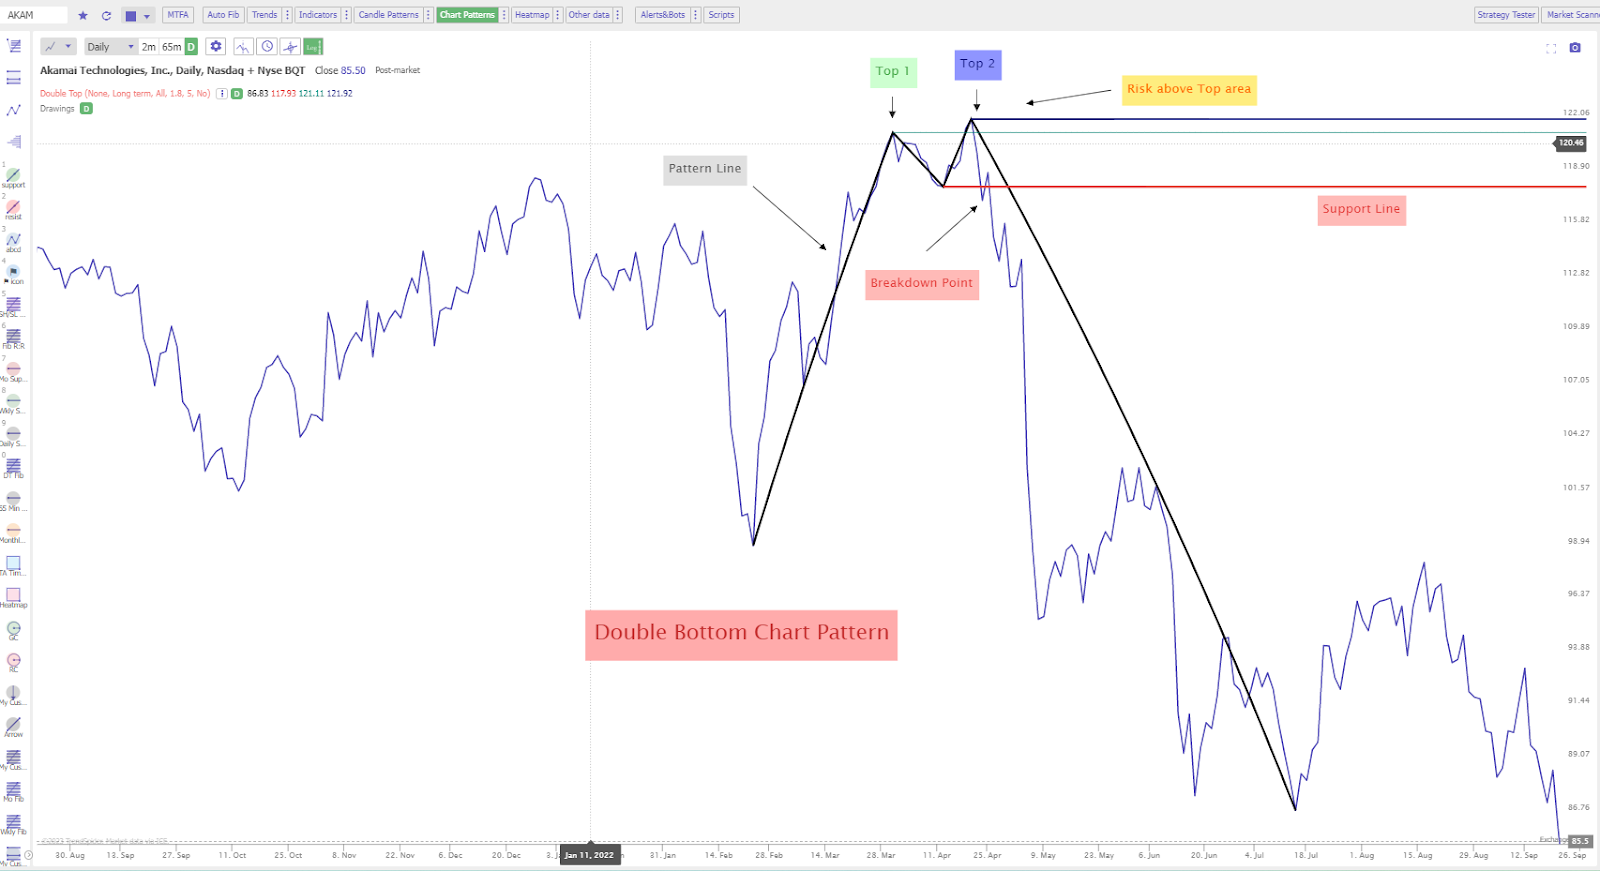
Double Top
Double Top is formed by the price action which moves up, then hits the price level (top 1), then bounces back (trough) and then hits approximately the same level again (top 2). In case if after that the price action goes below the trough, this Double Top is considered to be confirmed.
Discarding stale patterns: We'll only detect Double Tops which are either fully formed (even if in the past) and were never invalidated the hard way, or the ones which are currently evolving. We start identifying a Double Top as soon as top 2 level is reached.
Input parameters:
Retracement. Enabling this parameter adds Fib Retracement lines based on a leg of the pattern (the one you select in the pattern settings dialog).Time Span. This parameter can be eitherShort TermorLong Term. It regulates what kind of patterns (bigger or smaller, so to say) should be preferred, by adjusting a number of low-level technical inputs for the Recognition logic.Type. This parameter can be eitherAllorConfirmed. If set toConfirmedthen all the patterns which have not been confirmed (see above) will be discarded. This parameter is especially useful for scanning.Max peak distance(2 parameters, ATR and Percentage). You can use these parameters to define how far your Tops can be from each other (in terms of a price) in order for the formation to still be legit for you. On every chart, our engine will find which distance (ATR or Percentage) is the smallest one at a given chart, and then it will discard all the Double Tops where Tops are further than this limit. I.e., if yourMax peak dist, ATRis 2 andMax peak dist, %is 1, then our engine will compute 2xATR and 1% of the first Top of each formation, and then make sure that the second Top is never further than 2xATR and never further than 1% from the first Top.
Double Bottom
A vertically reversed version of a Double Top pattern.

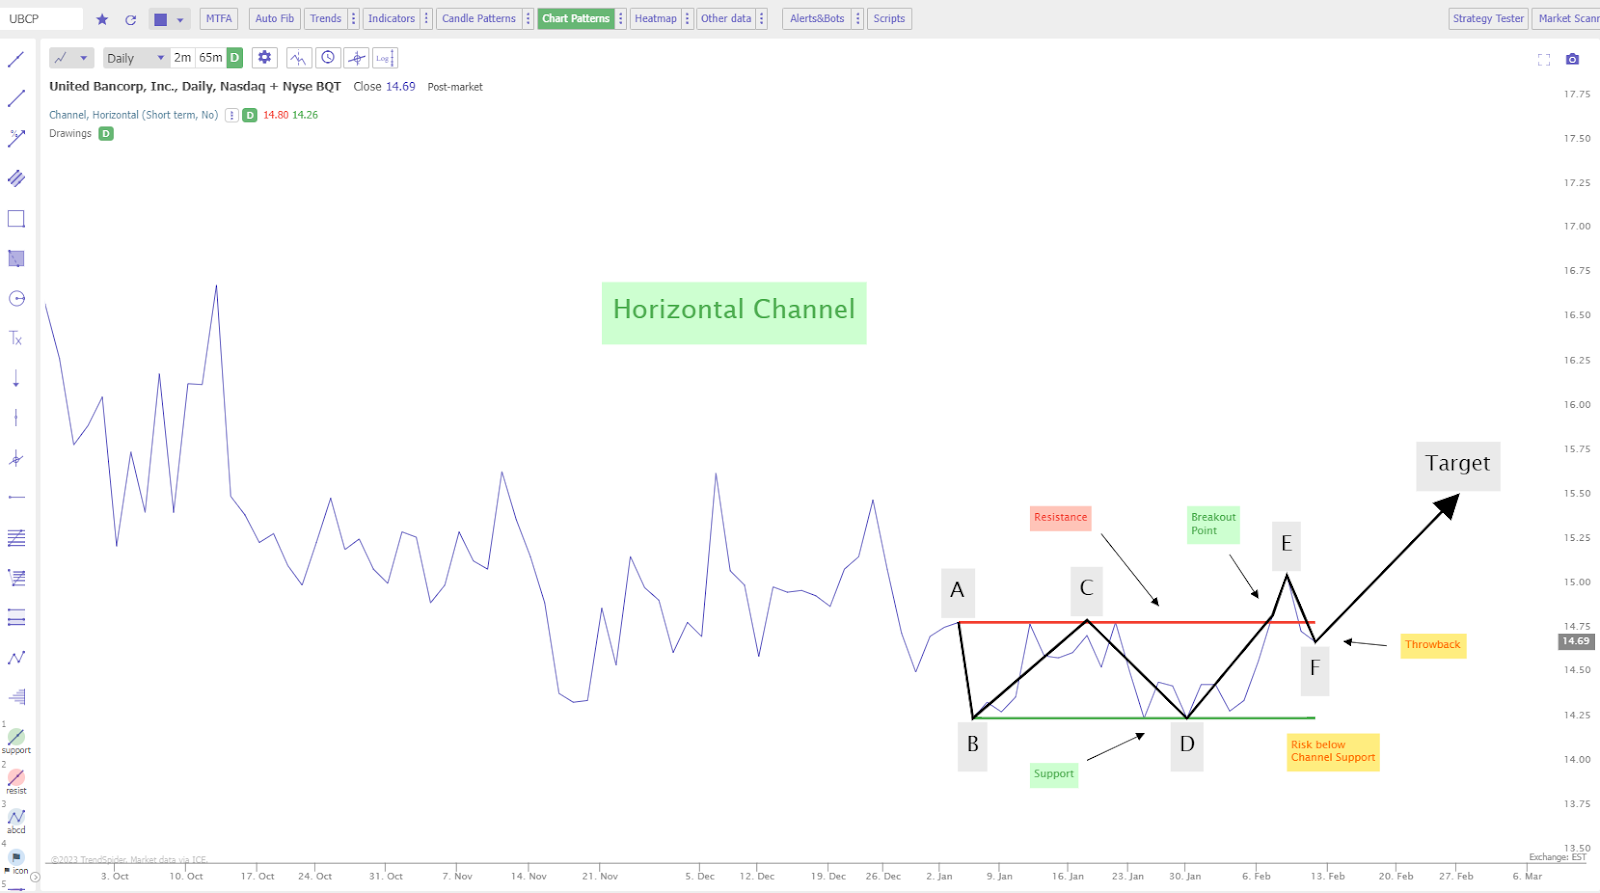
Channel, Horizontal
Horizontal Channel is formed by the price action which stays within a range for a while, bouncing up and down from horizontal (well, "almost horizontal") levels of support and resistance.
Discarding stale patterns: Channels are discarded after a while since price leaves the channel and goes too far from it. We allow for some price level violations in cases when they do not seem to change the principal picture. This means that sometimes you'd see us identifying channels which had been violated by some candles in the past. We still believe that these are legitimate channels, and we think so because we identify our channels by picking lines and levels price action still seems to respect. As long as the channel's line is respected by the price (never mind from which side) it will remain.
Input parameters:
Time Span. This parameter can be eitherShort TermorLong Term. It regulates what kind of patterns (bigger or smaller, so to say) should be preferred, by adjusting a number of low-level technical inputs for the Recognition logic.
Channel, Ascending
Ascending Channel is formed by the price action which stays within a range for a while, bouncing up and down from lines of support and resistance. Both of these lines are supposed to be nearly parallel and going upwards.
Discarding stale patterns: The same as for Horizontal Channel
Input parameters: The same as for Horizontal Channel

Channel, Descending
Descending Channel is formed by the price action which stays within a range for a while, bouncing up and down from lines of support and resistance. Both of these lines are supposed to be nearly parallel and going down.
Discarding stale patterns: The same as for Horizontal Channel
Input parameters: The same as for Horizontal Channel

Head and Shoulders
A Head and Shoulders pattern is a reversal pattern that is formed when the price of an asset reaches a high point (the head), followed by a decline to a lower level (the neckline), and then another rally to a similar high point (the right shoulder). The pattern is considered to be bearish, as it suggests that the uptrend is coming to an end.
The Head and Shoulders pattern is made up of three peaks, with the middle peak (the head) being the highest. The neckline is formed by connecting the low points of the two troughs.
To be considered a valid Head and Shoulders pattern, the following criteria must be met:
- The head must be higher than the shoulders.
- The price must break below the neckline after the right shoulder is formed.
Discarding stale patterns:
We discard stale patterns when either case occurs
1) A new head and shoulders pattern
2) After shoulder 2 price never goes below neck line
Input Parameters:
Retracement: This parameter adds Fibonacci retracement lines based on a leg of the pattern (the one you select in the pattern settings dialog.Depth: Depth represents the number of candles without a second maximum or minimum deviation of the previous pivot.Deviation: Deviation defines the vertical distance from the previous pivot point. In essence, the larger the value, the deeper the troughs, and the smaller the value, the more shallow the troughs.Back Step: The back step parameter refers to the number of bars or candles that must pass before the pattern can change direction and draw a new line or swing.Bands: The ‘Bands’ option allows traders to add various styles of bands around the horizontal levels that coincide with the shoulders and head, as well as the neckline. These bands can be measured via an ATR, a Standard Deviation, a Constant, or a Percentage value.Head Height: The head height allows users to define the percentage distance between the head and left shoulder.
Inverse Head and Shoulders
An Inverse Head and Shoulders pattern is a reversal pattern that is formed when the price of an asset reaches a low point (the head), followed by a rally to a higher level (the neckline), and then another decline to a similar low point (the right shoulder). The pattern is considered to be bullish, as it suggests that the downtrend is coming to an end.
The Inverse Head and Shoulders pattern is made up of three troughs, with the middle trough (the head) being the lowest. The neckline is formed by connecting the high points of the two peaks.
To be considered a valid Inverse Head and Shoulders pattern, the following criteria must be met:
- The head must be lower than the shoulders.
- The price must break above the neckline after the right shoulder is formed.
Discarding stale patterns:
We discard stale patterns when either case occurs
1) A new inverse head and shoulders pattern
2) After shoulder 2 price never goes above neck line
Input Parameters:
Retracement: This parameter adds Fibonacci retracement lines based on a leg of the pattern (the one you select in the pattern settings dialog.Depth: Depth represents the number of candles without a second maximum or minimum deviation of the previous pivot.Deviation: Deviation defines the vertical distance from the previous pivot point. In essence, the larger the value, the deeper the troughs, and the smaller the value, the more shallow the troughs.Back Step: The back step parameter refers to the number of bars or candles that must pass before the pattern can change direction and draw a new line or swing.Bands: The ‘Bands’ option allows traders to add various styles of bands around the horizontal levels that coincide with the shoulders and head, as well as the neckline. These bands can be measured via an ATR, a Standard Deviation, a Constant, or a Percentage value.Head Height: The head height allows users to define the percentage distance between the head and left shoulder.
Wedge, Rising
A Rising Wedge is formed by a price action which primarily bounces back and forth between two lines, both of which have slope and intersect somewhere in the future. Both lines should be going upwards in order for a pattern to be a Rising Wedge.
Discarding stale patterns: Wedges are discarded after a while since price leaves the range and goes too far from it. We allow for some price level violations in cases when they do not seem to change the principal picture. This means that sometimes you'd see us identifying wedges which had been violated by some candles in the past. We still believe that these are legitimate patterns, and we think so because we identify our wedges by picking lines and levels price action still seems to respect. As long as the wedge's line is respected by the price (never mind from which side), it will remain.
Input parameters:
Time Span. This parameter can be eitherShort TermorLong Term. It regulates what kind of patterns (bigger or smaller, so to say) should be preferred, by adjusting a number of low-level technical inputs for the Recognition logic.
Wedge, Falling
The definition for Falling Wedge is similar to a Rising Wedge, but the lines are supposed to go down.
Discarding stale patterns: The same as for Rising Wedge
Input parameters: The same as for Rising Wedge
Cup and Handle
A Cup and Handle is a pattern formed when the price action creates a rounded, U-shaped trough (the "cup"), followed by a smaller, shallower consolidation or pullback (the "handle"). In its classical definition, popularized by William O'Neil, the pattern is a bullish continuation setup that forms during an uptrend. However, TrendSpider's detection is trend-agnostic — meaning the engine will identify the formation wherever it appears on the chart, regardless of the prevailing trend. This means you may see Cup and Handle patterns detected mid-uptrend (the classical continuation setup), at the bottom of a downtrend (where it behaves more like a rounded bottom reversal), or in a ranging market.
Discarding stale patterns: We'll only detect Cup and Handle patterns which are either still forming or have recently played out. Patterns where the handle has extended too far or where price action has moved too far beyond the pattern boundaries are discarded.
Input parameters:
Time Span. This parameter can be eitherShort TermorLong Term. It regulates what kind of patterns (bigger or smaller, so to say) should be preferred, by adjusting a number of low-level technical inputs for the Recognition logic.Inverted. When enabled, this option detects the inverse version of the pattern.Retracement. When set toYes, this parameter adds Fibonacci retracement lines based on a leg of the pattern, which can help identify potential support and resistance levels within the formation.Bands. TheBandsoption allows traders to add bands around the key horizontal levels of the pattern, helping to visualize areas of interest around the cup's pivot levels and the handle's range.
The pattern is visualized on the chart with lines identifying five key structural levels: the 1st pivot level and 2nd pivot level (the highs on either side of the cup), the Handle end level (where the handle concludes and a potential breakout begins), the Cup (the rounded base), and the Handle itself.
What went wrong? (Optional)